

Case Study
OK analytics: the funnel before the fix
OK leadership flew blind on pricing, carts and catalog. I scoped a 5-week Mixpanel integration across client and server with identity stitching and nine answered business questions.

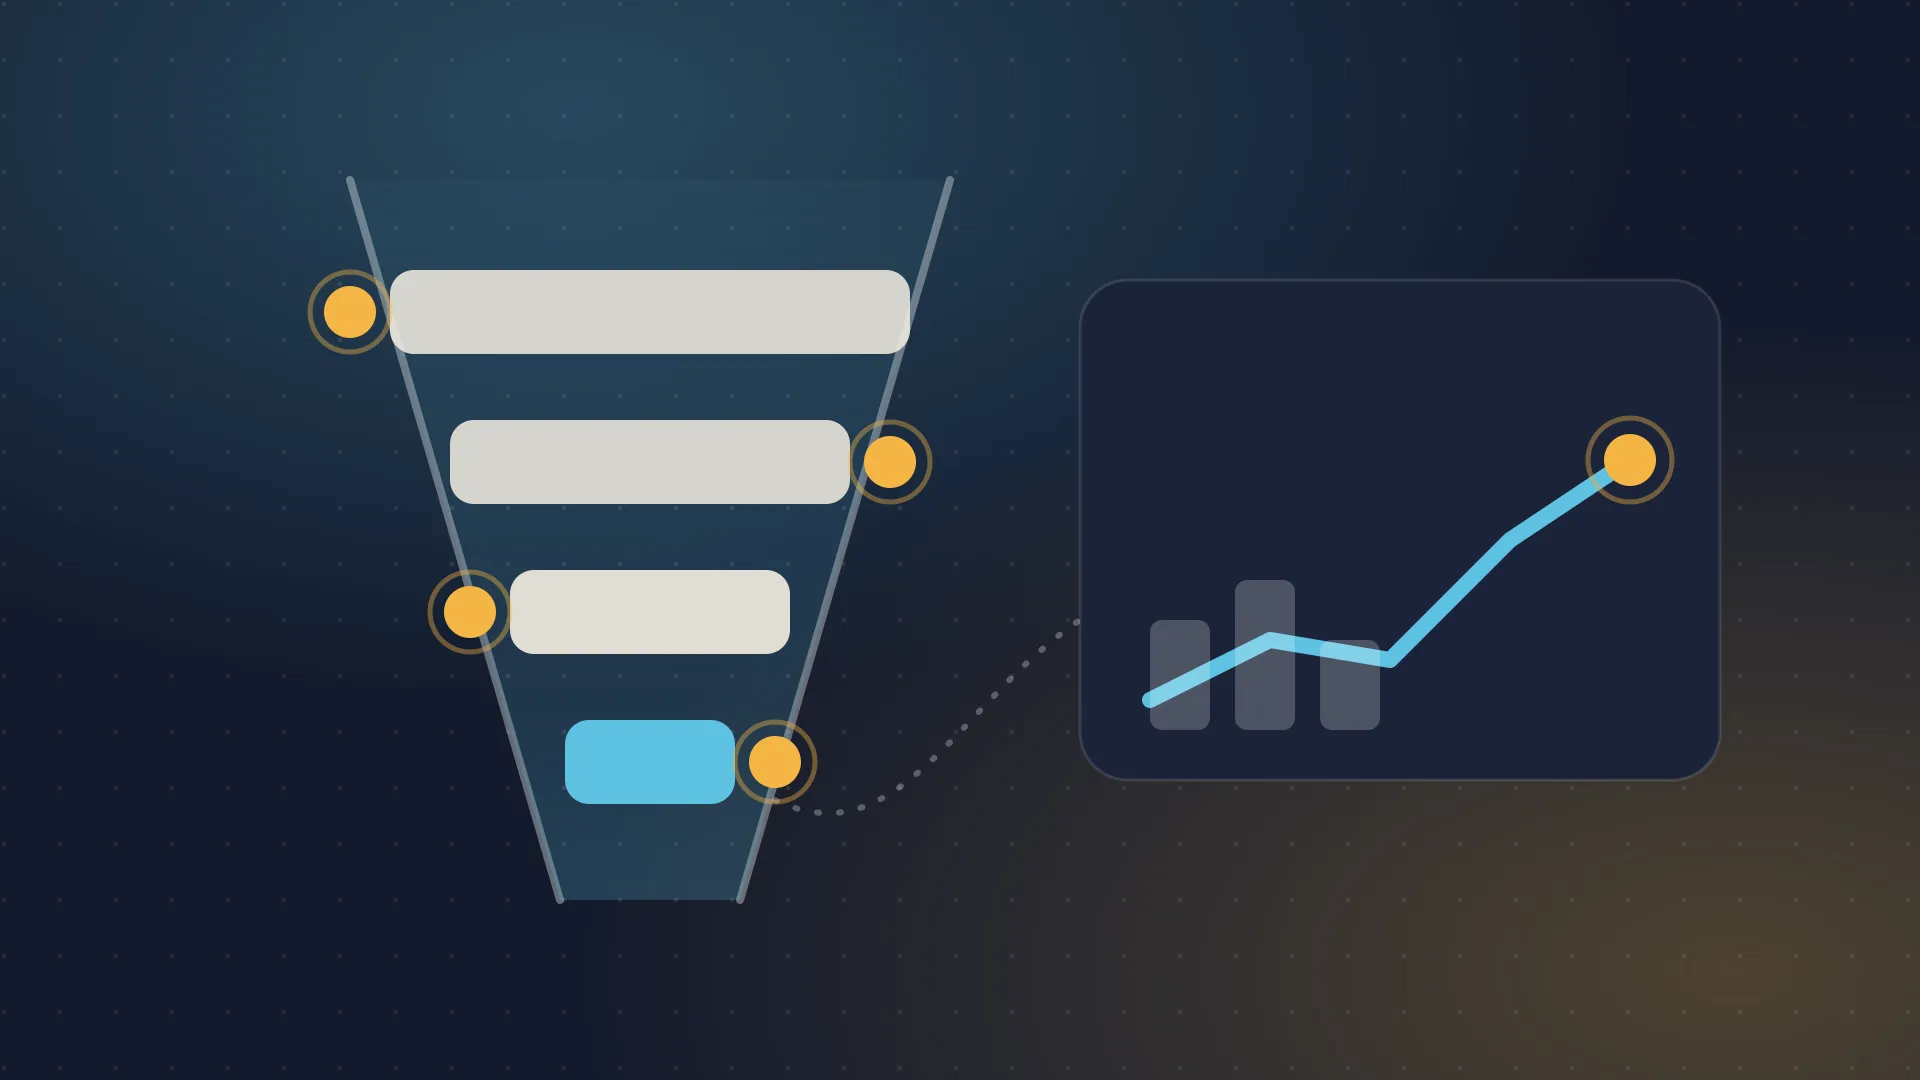
At OK, the 10-minute grocery delivery brand inside SuperAGI, the AI company I work at, the database logged terminal states: orders placed, accounts created. Everything between intent and purchase was invisible. I wrote the PRD that instrumented the funnel before anyone tried to optimize it.
Problem and context
The review went like this every week. A category manager raised milk prices on Monday. Orders dipped by Friday. Half the room blamed the hike, half blamed the season, and nobody could prove either, because the system recorded the price edit and the order dip in two places that never met. The argument ended where it started, with the loudest voice winning.
Three more questions died the same death:
- Carts abandoned at checkout during peak hours, and nobody knew whether long delivery ETAs or missing items scared them off.
- A new snack under our own store brand launched, and nobody knew whether it grew GMV, gross merchandise value, or cannibalized it.
- Shoppers searched daily for items procurement never stocked, and those searches vanished into the void because searches were never recorded at all.
In 10-minute delivery, margins are thin and velocity is high. Even a 1% search-to-cart lift moves GMV. We were leaving those decisions to instinct while sitting on the data exhaust to answer them.
Discovery and validation
The PRD opens with pain points per role, not events per screen, because the gap was organizational before it was technical. PMs could not see hour-by-hour behavior, which meant flash sales launched on feel and surge fees guessed at demand. Category managers could not separate price effects from noise, so every pricing review ended the way the milk one did. Support leads could not connect friction to operations, so refunds stayed anecdotes told loudly in meetings. Procurement restocked from gut while out-of-stock searches went uncounted in the dark.
The common root ran one level down. Transient behavior was never recorded, so every analysis started from order logs and worked backward, like reconstructing a journey from its destination. The fix had to be a telemetry schema first and dashboards second, because dashboards without events are mockups with colors.
Trade-offs and prioritization
The scope fits five weeks: design in week one, SDKs in weeks two and three, dashboards and QA in week four, launch in week five. To hold that, three cuts, each with a named home later. Picker and rider apps wait for operational PRDs. Marketing CRM integrations wait past V1. Old logs never get backfilled, so tracking starts fresh from launch day and early trends lean on database history.
Two constraints shaped the design more than any feature did. Identity stitching through alias plus identify prevents duplicate profiles, with success set at 100% merge on login and under 2% order discrepancy against the database, because a funnel built on split identities lies confidently. Privacy under India’s data protection rules means no plain-text PII in events and hashed contacts, with event queuing capped so tracking never slows rendering past 15ms. Analytics that slows the shopper poisons its own data.
How one guest becomes one user:
sequenceDiagram
    actor App as Consumer app
    participant BE as Backend
    participant MP as Mixpanel
    App->>MP: Product Viewed (guest device ID)
    App->>BE: Register (guest device ID)
    BE->>MP: alias(user ID, guest device ID)
    BE->>App: User token
    App->>MP: identify(user ID)
    App->>MP: Order Placed (user ID)
Execution and alignment
Client SDKs on the consumer app capture navigation, search, views and checkout steps. Server SDKs on backend and admin services capture transactions, refunds and price changes. Every event carries fulfillment center and city as super properties, so each dashboard filters by region down to a single dark store, the small warehouse each neighborhood delivers from, and a manager in Bengaluru stops answering for Mumbai.
Nine business questions got exact report recipes instead of vague requirements. The four that mattered most:
- Hourly activity plots as a line chart, so flash sales plan around real peaks.
- Cart abandonment segments by ETA bands, so slow windows finally show up in data instead of arguments.
- Out-of-stock views rank by product, so procurement restocks demand instead of gut.
- The price test runs view-to-order funnels segmented by a backend-supplied flag, comparing items with recent hikes against unchanged ones. That flag is the Monday milk argument, settled by construction.
The four recipes, in one table:
| Question | Report shape | Decision it settles |
|---|---|---|
| When do shoppers buy | Hourly activity line chart | Flash sale timing and surge fees |
| Why do carts stall | Abandonment segments by ETA bands | Slow delivery windows versus missing items |
| What do gaps cost | Out-of-stock views ranked by product | Procurement restocking order |
| Did the price move demand | View-to-order funnels by hike flag | Price effects versus noise |
QA was specified, not assumed, because silent data corruption is worse than no data. Live View debugging during implementation. Network audits on tracking calls. And distinct_id matching between checkout start and order placed, since mismatched IDs break funnels without a single error anywhere.
Measurable outcomes
The PRD set acceptance bars instead of promising lifts:
- Profiles merge fully on login, with order discrepancy under 2% against the database.
- Search null rate stays under 4%, reviewed daily by category managers.
- The refund analytics work consumes the
Refund Issuedevent with its dropdown reason, turning a tracking decision into abuse leaderboards and fulfillment-center error rates.
At OK scale the program context is eight-figure GMV with 60% repeat purchase, which is exactly when blind pricing turns expensive. This project has no external channel. Its only distribution is internal trust, earned one correct call at a time.
Retrospective and learnings
Fresh-only tracking was the dearest cut. It kept week five achievable, but trend lines needed weeks to mature, and early skeptics pointed at empty charts as proof the project was empty. Weekly SQL reconciliation bridged the gap, holding discrepancy under 5% by hand until automation arrived. Alerting thresholds went to V2 for the same reason: scope discipline now, honest manual coverage meanwhile.
The assumption that held: instrument the decision first, optimize second. Nobody argues about the milk anymore. The funnel answers before the meeting starts, and every later win at OK, from procurement fixes to price tests, runs on pipes this PRD laid.

Written by
Prathamesh Pathak
Building AI-native products. Writing about PM craft, career growth, and shipping.
Visit LinkedIn →More case studies
Cloud coder: selling dev tools to non-dev companies
Week one showed over ten lakh rupees in monthly recurring pipeline. AI coding environments for agencies and non-engineering firms, scoped tight for launch.
 Prathamesh Pathak · ·3 min read

OK support: a bot that resolves first
Mining 50 real chat scenarios, I redesigned the bot around an FAQ plus Yes/No loop, removing roughly 40 percent of the agent queue.
Prathamesh Pathak · ·6 min read